Hypothesis testing in Python#
In this chapter we will present several examples of using Python to perform hypothesis testing.
Simple example: Coin-flipping#
Let’s say that we flipped 100 coins and observed 70 heads. We would like to use these data to test the hypothesis that the true probability is 0.5. First let’s generate our data, simulating 200,000 sets of 100 flips. We use such a large number because it turns out that it’s very rare to get 70 heads, so we need many attempts in order to get a reliable estimate of these probabilties. This will take a couple of minutes to complete.
import numpy as np
import pandas as pd

num_runs = 200000


def toss_coins_and_count_heads(num_coins=100, p_heads=0.5):
    """
    flip a coin num_coins times and return number of heads
    """

    flips = np.random.rand(num_coins) > (1 - p_heads)
    return(np.sum(flips))


flip_results_df = pd.DataFrame({'n_heads': np.zeros(num_runs)})

for run in range(num_runs):
    flip_results_df.loc[run, 'n_heads'] = toss_coins_and_count_heads()
Now we can compute the proportion of samples from the distribution observed that landed on head for at least 70 times, when the true probability of heads is 0.5.
import scipy.stats

pvalue = 100 - scipy.stats.percentileofscore(flip_results_df['n_heads'], 70)
print(pvalue)
0.002250000000003638
For comparison, we can also compute the p-value for 70 or more heads based on a null hypothesis of \(P_{heads}=0.5\), using the binomial distribution.
compute the probability of 69 or fewer heads, when P(heads)=0.5
p_lt_70 = scipy.stats.binom.cdf(k=69, n=100, p=0.5)
p_lt_70
0.999960749301772
the probability of 70 or more heads is simply the complement of p_lt_70
p_ge_70 = 1 - p_lt_70
p_ge_70
#
3.925069822796612e-05
Performing t-test with Python#
Let’s draw a sample of 250 participants from the “population” who participated the NHANES study
! pip install nhanes
from nhanes.load import load_NHANES_data
nhanes_data = load_NHANES_data()
Requirement already satisfied: nhanes in /miniconda/lib/python3.12/site-packages (0.5.1)
WARNING: Running pip as the 'root' user can result in broken permissions and conflicting behaviour with the system package manager. It is recommended to use a virtual environment instead: https://pip.pypa.io/warnings/venv
import numpy as np
import seaborn as sns
sample_size = 250
nhanes_data['PhysActive'] = np.logical_or(nhanes_data['VigorousRecreationalActivities'], nhanes_data['ModerateRecreationalActivities'])
print('Unique values in PhysActive:',nhanes_data['PhysActive'].unique())
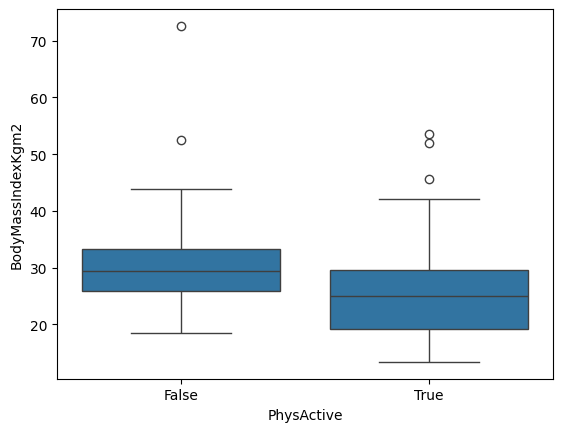
sample = nhanes_data.dropna(subset=['PhysActive', 'BodyMassIndexKgm2']).sample(sample_size)
sns.boxplot(data=sample, x="PhysActive", y="BodyMassIndexKgm2")
Unique values in PhysActive: [ True False]
<Axes: xlabel='PhysActive', ylabel='BodyMassIndexKgm2'>
We will use scipy.stats.ttest_ind to perform t-test between two independently drawn samples.
from scipy.stats import ttest_ind
# By default, ttest_ind assumes equal variance of the two samples
print('assuming equal variance of the two population:')
t, p = ttest_ind(sample.query('PhysActive==1.0')['BodyMassIndexKgm2'], sample.query('PhysActive==0.0')['BodyMassIndexKgm2'])
print('t-statistic:', t)
print('p-value:', p)

# If we don't make the assumption, the result may be slightly different:
print('without assuming equal variance of the two populations:')
t, p = ttest_ind(sample.query('PhysActive==1.0')['BodyMassIndexKgm2'], sample.query('PhysActive==0.0')['BodyMassIndexKgm2'], equal_var=False)
print('t-statistic:', t)
print('p-value:', p)
assuming equal variance of the two population:
t-statistic: -5.316941860027617
p-value: 2.354151901662167e-07
without assuming equal variance of the two populations:
t-statistic: -5.2610355104492506
p-value: 4.255126801088449e-07
Simulating p-values#
In this exercise we will perform hypothesis testing many times in order to test whether the p-values provided by our statistical test are valid. We will sample data from a normal distribution with a mean of zero, and for each sample perform a t-test to determine whether the mean is different from zero. We will then count how often we reject the null hypothesis; since we know that the true mean is zero, these are by definition Type I errors.
num_runs = 5000


# create a function that will take a sample
# and perform a one-sample t-test
def sample_ttest(sampSize=32):
    """
    perform a ttest on random data of n=sampSize
    """

    ttresult = scipy.stats.ttest_1samp(np.random.normal(loc=0.0, scale=1.0, size=sampSize), 0)
    return(ttresult.pvalue)


# create input data frame for the function
sim_results_df = pd.DataFrame({'p_value': np.zeros(num_runs)})

# perform simulations
for run in range(num_runs):
    sim_results_df.loc[run, 'p_value'] = sample_ttest()

p_error = sim_results_df['p_value'] < 0.05
p_error = p_error.mean(axis=0)
p_error
0.0456
We should see that the proportion of samples with p < .05 is about 5%.