%%R
library(tidyverse)
library(cowplot)
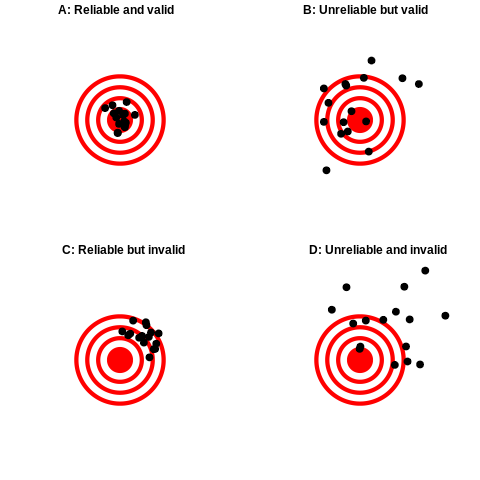
# Figure inspired by https://commons.wikimedia.org/wiki/File:Reliability_and_validity.svg
# from https://stackoverflow.com/questions/6862742/draw-a-circle-with-ggplot2
set.seed(12345)
gg_circle <- function(r, xc, yc, color="black", fill=NA, ...) {
x <- xc + r*cos(seq(0, pi, length.out=100))
ymax <- yc + r*sin(seq(0, pi, length.out=100))
ymin <- yc + r*sin(seq(0, -pi, length.out=100))
annotate("ribbon", x=x, ymin=ymin, ymax=ymax, color=color, fill=fill, ...)
}
npoints <- 16
rel_mult <- 0.75
unrel_mult <- 2.5
plotDf <- tibble(
X_RelVal = rnorm(npoints)*rel_mult,
Y_RelVal = rnorm(npoints)*rel_mult,
X_RelInval = rnorm(npoints)*rel_mult+2,
Y_RelInval = rnorm(npoints)*rel_mult+2,
X_UnrelInval = rnorm(npoints)*unrel_mult+2,
Y_UnrelInval = rnorm(npoints)*unrel_mult+2,
X_UnrelVal = rnorm(npoints)*unrel_mult,
Y_UnrelVal = rnorm(npoints)*unrel_mult
)
pointsize <- 3
linesize=2
p1=ggplot(plotDf,aes(X_RelVal,Y_RelVal)) +
gg_circle(r=4, xc=0.0, yc=0.0,size=linesize,color='red') +
gg_circle(r=3, xc=0.0, yc=0.0,size=linesize,color='red') +
gg_circle(r=2, xc=0.0, yc=0.0,size=linesize,color='red') +
gg_circle(r=1, xc=0.0, yc=0.0,size=linesize,color='red',fill='red') +
geom_point(size=pointsize) +
xlim(-10,10) + ylim(-10,10) +
theme_void()
p2=ggplot(plotDf,aes(X_UnrelVal,Y_UnrelVal)) +
gg_circle(r=4, xc=0.0, yc=0.0,size=linesize,color='red') +
gg_circle(r=3, xc=0.0, yc=0.0,size=linesize,color='red') +
gg_circle(r=2, xc=0.0, yc=0.0,size=linesize,color='red') +
gg_circle(r=1, xc=0.0, yc=0.0,size=linesize,color='red',fill='red') +
geom_point(size=pointsize) +
xlim(-10,10) + ylim(-10,10) +
theme_void()
p3=ggplot(plotDf,aes(X_RelInval,Y_RelInval)) +
gg_circle(r=4, xc=0.0, yc=0.0,size=linesize,color='red') +
gg_circle(r=3, xc=0.0, yc=0.0,size=linesize,color='red') +
gg_circle(r=2, xc=0.0, yc=0.0,size=linesize,color='red') +
gg_circle(r=1, xc=0.0, yc=0.0,size=linesize,color='red',fill='red') +
geom_point(size=pointsize) +
xlim(-10,10) + ylim(-10,10) +
theme_void()
p4=ggplot(plotDf,aes(X_UnrelInval,Y_UnrelInval)) +
gg_circle(r=4, xc=0.0, yc=0.0,size=linesize,color='red') +
gg_circle(r=3, xc=0.0, yc=0.0,size=linesize,color='red') +
gg_circle(r=2, xc=0.0, yc=0.0,size=linesize,color='red') +
gg_circle(r=1, xc=0.0, yc=0.0,size=linesize,color='red',fill='red') +
geom_point(size=pointsize) +
xlim(-10,10) + ylim(-10,10) +
theme_void()
plot_grid(p1,p2,p3,p4,ncol=2,label_size=12,
labels=c('A: Reliable and valid',
'B: Unreliable but valid',
'C: Reliable but invalid',
'D: Unreliable and invalid'))