Chapter 1 Introduction
“Statistical thinking will one day be as necessary for efficient citizenship as the ability to read and write.” - H.G. Wells
1.1 What is statistical thinking?
Statistical thinking is a way of understanding a complex world by describing it in relatively simple terms that nonetheless capture essential aspects of its structure or function, and that also provide us some idea of how uncertain we are about that knowledge. The foundations of statistical thinking come primarily from mathematics and statistics, but also from computer science, psychology, and other fields of study.
We can distinguish statistical thinking from other forms of thinking that are less likely to describe the world accurately. In particular, human intuition often tries to answer the same questions that we can answer using statistical thinking, but often gets the answer wrong. For example, in recent years most Americans have reported that they think that violent crime was worse compared to the previous year (Pew Research Center). However, a statistical analysis of the actual crime data shows that in fact violent crime has steadily decreased since the 1990’s. Intuition fails us because we rely upon best guesses (which psychologists refer to as heuristics) that can often get it wrong. For example, humans often judge the prevalence of some event (like violent crime) using an availability heuristic – that is, how easily can we think of an example of violent crime. For this reason, our judgments of increasing crime rates may be more reflective of increasing news coverage, in spite of an actual decrease in the rate of crime. Statistical thinking provides us with the tools to more accurately understand the world and overcome the biases of human judgment.
1.2 Dealing with statistics anxiety
Many people come to their first statistics class with a lot of trepidation and anxiety, especially once they hear that they will also have to learn to code in order to analyze data. In my class I give students a survey prior to the first session in order to measure their attitude towards statistics, asking them to rate a number of statements on a scale of 1 (strongly disagree) to 7 (strongly agree). One of the items on the survey is “The thought of being enrolled in a statistics course makes me nervous”. In a recent class, almost two-thirds of the class responded with a five or higher, and about one-fourth of the students said that they strongly agreed with the statement. So if you feel nervous about starting to learn statistics, you are not alone.
Anxiety feels uncomfortable, but psychology tells us that this kind of emotional arousal can actually help us perform better on many tasks, by focusing our attention. So if you start to feel anxious about the material in this book, remind yourself that many other readers are feeling similarly, and that this emotional arousal could actually help you learn the material better (even if it doesn’t seem like it!).
1.3 What can statistics do for us?
There are three major things that we can do with statistics:
- Describe: The world is complex and we often need to describe it in a simplified way that we can understand.
- Decide: We often need to make decisions based on data, usually in the face of uncertainty.
- Predict: We often wish to make predictions about new situations based on our knowledge of previous situations.
Let’s look at an example of these in action, centered on a question that many of us are interested in: How do we decide what’s healthy to eat? There are many different sources of guidance; government dietary guidelines, diet books, and bloggers, just to name a few. Let’s focus in on a specific question: Is saturated fat in our diet a bad thing?
One way that we might answer this question is common sense. If we eat fat, then it’s going to turn straight into fat in our bodies, right? And we have all seen photos of arteries clogged with fat, so eating fat is going to clog our arteries, right?
Another way that we might answer this question is by listening to authority figures. The Dietary Guidelines from the US Food and Drug Administration have as one of their Key Recommendations that “A healthy eating pattern limits saturated fats”. You might hope that these guidelines would be based on good science, and in some cases they are, but as Nina Teicholz outlined in her book “Big Fat Surprise”(Teicholz 2014), this particular recommendation seems to be based more on the longstanding dogma of nutrition researchers than on actual evidence.
Finally, we might look at actual scientific research. Let’s start by looking at a large study called the PURE study, which has examined diets and health outcomes (including death) in more than 135,000 people from 18 different countries. In one of the analyses of this dataset (published in The Lancet in 2017; Dehghan et al. (2017)), the PURE investigators reported an analysis of how intake of various classes of macronutrients (including saturated fats and carbohydrates) was related to the likelihood of dying during the time that people were followed. People were followed for a median of 7.4 years, meaning that half of the people in the study were followed for less and half were followed for more than 7.4 years. Figure 1.1 plots some of the data from the study (extracted from the paper), showing the relationship between the intake of both saturated fats and carbohydrates and the risk of dying from any cause.
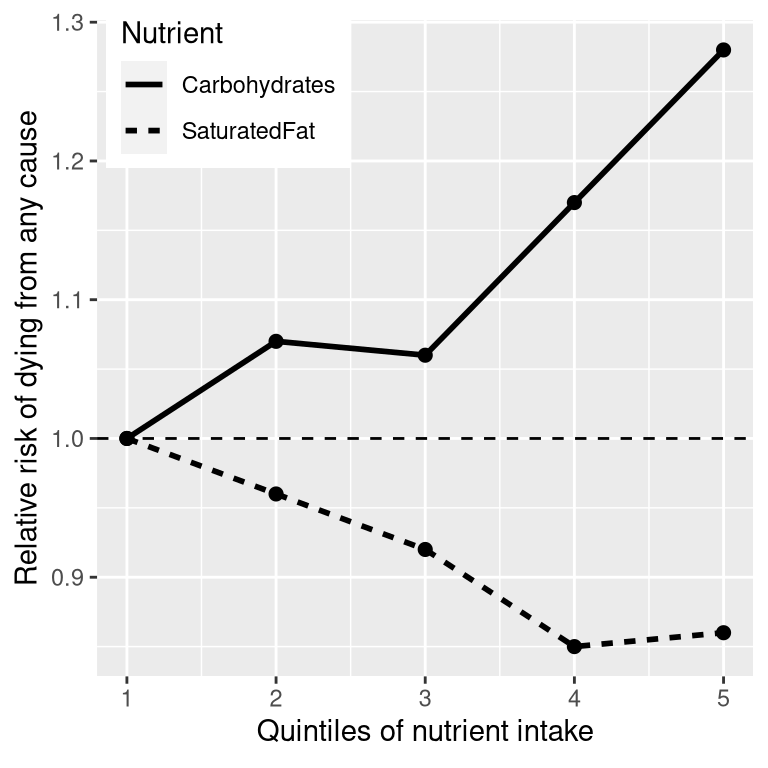
Figure 1.1: A plot of data from the PURE study, showing the relationship between death from any cause and the relative intake of saturated fats and carbohydrates.
This plot is based on ten numbers. To obtain these numbers, the researchers split the group of 135,335 study participants (which we call the “sample”) into 5 groups (“quintiles”) after ordering them in terms of their intake of either of the nutrients; the first quintile contains the 20% of people with the lowest intake, and the 5th quintile contains the 20% with the highest intake. The researchers then computed how often people in each of those groups died during the time they were being followed. The figure expresses this in terms of the relative risk of dying in comparison to the lowest quintile: If this number is greater than one, it means that people in the group are more likely to die than are people in the lowest quintile, whereas if it’s less than one, it means that people in the group are less likely to die. The figure is pretty clear: People who ate more saturated fat were less likely to die during the study, with the lowest death rate seen for people who were in the fourth quintile (that is, who ate more fat than the lowest 60% but less than the top 20%). The opposite is seen for carbohydrates; the more carbs a person ate, the more likely they were to die during the study. This example shows how we can use statistics to describe a complex dataset in terms of a much simpler set of numbers; if we had to look at the data from each of the study participants at the same time, we would be overloaded with data and it would be hard to see the pattern that emerges when they are described more simply.
The numbers in Figure 1.1 seem to show that deaths decrease with saturated fat and increase with carbohydrate intake, but we also know that there is a lot of uncertainty in the data; there are some people who died early even though they ate a low-carb diet, and, similarly, some people who ate a ton of carbs but lived to a ripe old age. Given this variability, we want to decide whether the relationships that we see in the data are large enough that we wouldn’t expect them to occur randomly if there was not truly a relationship between diet and longevity. Statistics provide us with the tools to make these kinds of decisions, and often people from the outside view this as the main purpose of statistics. But as we will see throughout the book, this need for black-and-white decisions based on fuzzy evidence has often led researchers astray.
Based on the data we would also like to make predictions about future outcomes. For example, a life insurance company might want to use data about a particular person’s intake of fat and carbohydrate to predict how long they are likely to live. An important aspect of prediction is that it requires us to generalize from the data we already have to some other situation, often in the future; if our conclusions were limited to the specific people in the study at a particular time, then the study would not be very useful. In general, researchers must assume that their particular sample is representative of a larger population, which requires that they obtain the sample in a way that provides an unbiased picture of the population. For example, if the PURE study had recruited all of its participants from religious sects that practice vegetarianism, then we probably wouldn’t want to generalize the results to people who follow different dietary standards.
1.4 The big ideas of statistics
There are a number of very basic ideas that cut through nearly all aspects of statistical thinking. Several of these are outlined by Stigler (2016) in his outstanding book “The Seven Pillars of Statistical Wisdom”, which I have augmented here.
1.4.1 Learning from data
One way to think of statistics is as a set of tools that enable us to learn from data. In any situation, we start with a set of ideas or hypotheses about what might be the case. In the PURE study, the researchers may have started out with the expectation that eating more fat would lead to higher death rates, given the prevailing negative dogma about saturated fats. Later in the course we will introduce the idea of prior knowledge, which is meant to reflect the knowledge that we bring to a situation. This prior knowledge can vary in its strength, often based on our amount of experience; if I visit a restaurant for the first time, I am likely to have a weak expectation of how good it will be, but if I visit a restaurant where I have eaten ten times before, my expectations will be much stronger. Similarly, if I look at a restaurant review site and see that a restaurant’s average rating of four stars is only based on three reviews, I will have a weaker expectation than I would if it was based on 300 reviews.
Statistics provides us with a way to describe how new data can be best used to update our beliefs, and in this way there are deep links between statistics and psychology. In fact, many theories of human and animal learning from psychology are closely aligned with ideas from the new field of machine learning. Machine learning is a field at the interface of statistics and computer science that focuses on how to build computer algorithms that can learn from experience. While statistics and machine learning often try to solve the same problems, researchers from these fields often take very different approaches; the famous statistician Leo Breiman once referred to them as “The Two Cultures” to reflect how different their approaches can be (Breiman 2001). In this book I will try to blend the two cultures together because both approaches provide useful tools for thinking about data.
1.4.2 Aggregation
Another way to think of statistics is as “the science of throwing away data”. In the example of the PURE study above, we took more than 100,000 numbers and condensed them into ten. It is this kind of aggregation that is one of the most important concepts in statistics. When it was first advanced, this was revolutionary: If we throw out all of the details about every one of the participants, then how can we be sure that we aren’t missing something important?
As we will see, statistics provides us ways to characterize the structure of aggregates of data, with theoretical foundations that explain why this usually works well. However, it’s also important to keep in mind that aggregation can go too far, and later we will encounter cases where a summary can provide a very misleading picture of the data being summarized.
1.4.3 Uncertainty
The world is an uncertain place. We now know that cigarette smoking causes lung cancer, but this causation is probabilistic: A 68-year-old man who smoked two packs a day for the past 50 years and continues to smoke has a 15% (1 out of 7) risk of getting lung cancer, which is much higher than the chance of lung cancer in a nonsmoker. However, it also means that there will be many people who smoke their entire lives and never get lung cancer. Statistics provides us with the tools to characterize uncertainty, to make decisions under uncertainty, and to make predictions whose uncertainty we can quantify.
One often sees journalists write that scientific researchers have “proven” some hypothesis. But statistical analysis can never “prove” a hypothesis, in the sense of demonstrating that it must be true (as one would in a logical or mathematical proof). Statistics can provide us with evidence, but it’s always tentative and subject to the uncertainty that is always present in the real world.
1.4.4 Sampling from a population
The concept of aggregation implies that we can make useful insights by collapsing across data – but how much data do we need? The idea of sampling says that we can summarize an entire population based on just a small number of samples from the population, as long as those samples are obtained in the right way. For example, the PURE study enrolled a sample of about 135,000 people, but its goal was to provide insights about the billions of humans who make up the population from which those people were sampled. As we already discussed above, the way that the study sample is obtained is critical, as it determines how broadly we can generalize the results. Another fundamental insight about sampling is that while larger samples are always better (in terms of their ability to accurately represent the entire population), there are diminishing returns as the sample gets larger. In fact, the rate at which the benefit of larger samples decreases follows a simple mathematical rule, growing as the square root of the sample size, such that in order to double the precision of our estimate we need to quadruple the size of our sample.
1.5 Causality and statistics
The PURE study seemed to provide pretty strong evidence for a positive relationship between eating saturated fat and living longer, but this doesn’t tell us what we really want to know: If we eat more saturated fat, will that cause us to live longer? This is because we don’t know whether there is a direct causal relationship between eating saturated fat and living longer. The data are consistent with such a relationship, but they are equally consistent with some other factor causing both higher saturated fat and longer life. For example, one might imagine that people who are richer eat more saturated fat and richer people tend to live longer, but their longer life is not necessarily due to fat intake — it could instead be due to better health care, reduced psychological stress, better food quality, or many other factors. The PURE study investigators tried to account for these factors, but we can’t be certain that their efforts completely removed the effects of other variables. The fact that other factors may explain the relationship between saturated fat intake and death is an example of why introductory statistics classes often teach that “correlation does not imply causation”, though the renowned data visualization expert Edward Tufte has added, “but it sure is a hint.”
Although observational research (like the PURE study) cannot conclusively demonstrate causal relations, we generally think that causation can be demonstrated using studies that experimentally control and manipulate a specific factor. In medicine, such a study is referred to as a randomized controlled trial (RCT). Let’s say that we wanted to do an RCT to examine whether increasing saturated fat intake increases life span. To do this, we would sample a group of people, and then assign them to either a treatment group (which would be told to increase their saturated fat intake) or a control group (who would be told to keep eating the same as before). It is essential that we assign the individuals to these groups randomly. Otherwise, people who choose the treatment might be different in some way than people who choose the control group – for example, they might be more likely to engage in other healthy behaviors as well. We would then follow the participants over time and see how many people in each group died. Because we randomized the participants to treatment or control groups, we can be reasonably confident that there are no other differences between the groups that would confound the treatment effect; however, we still can’t be certain because sometimes randomization yields treatment versus control groups that do vary in some important way. Researchers often try to address these confounds using statistical analyses, but removing the influence of a confound from the data can be very difficult.
A number of RCTs have examined the question of whether changing saturated fat intake results in better health and longer life. These trials have focused on reducing saturated fat because of the strong dogma amongst nutrition researchers that saturated fat is deadly; most of these researchers would have probably argued that it was not ethical to cause people to eat more saturated fat! However, the RCTs have shown a very consistent pattern: Overall there is no appreciable effect on death rates of reducing saturated fat intake.
1.6 Learning objectives
Having read this chapter, you should be able to:
- Describe the central goals and fundamental concepts of statistics
- Describe the difference between experimental and observational research with regard to what can be inferred about causality
- Explain how randomization provides the ability to make inferences about causation.